The first part of this chapter presents a general picture about report distribution performance and some high level performance guidelines for getting an increased throughput from the DocumentBurster™ software.
The last section shows a simple, yet powerful, DocumentBurster™ tool for monitoring various report bursting and report delivery performance metrics.
DocumentBurster™ hardware requirements will depend on the volume and the size of the reports which the system is expected to process and distribute. The system can scale in order to support the most demanding report distribution performance requirements.
In most of the situations, DocumentBurster™ should perform well enough on any low-end machine which can decently run Windows XP. However, if your enterprise organization is expected to process really huge reports, it is advisable to allocate a dedicated and powerful machine.
Following are the hardware devices which have an influence on the overall system throughput
- Network performance - The quality of network and the size of the files transferred will have a considerable impact on the report distribution throughput. A good network bandwidth together with low network latency will have a positive impact when distributing a lot of reports by either email or other network based protocols.
- CPU, Disk I/O performance - More CPU power together with a good Disk I/O performance will improve the report bursting/separation throughput. DocumentBurster™ will benefit when running on a modern multi-core server machine.
- Memory - By default, DocumentBurster™ starts with 128MB and DocumentBurster™ Server starts with 256MB. The default memory configuration should be enough when processing really big reports (thousands of pages) and, if required, the memory can be further increased in order to process even bigger reports.
The most common scenario will be for DocumentBurster™ to distribute the reports by email. When a big number of reports is required to be distributed in a short period of time, deploying DocumentBurster™ software on the same physical machine with the email server (e.g. Microsoft Exchange) will mostly save the network overhead and will be like a boost for the overall report distribution throughput.
If possible, for email distribution performance reasons, install DocumentBurster™ on the same computer with the email server software (e.g. Microsoft Exchange).
Any intermediate layer which sits in-between DocumentBurster™ and the email server software will pose a performance penalty when the reports are being distributed. For example, a common situation will be with various antivirus/firewall (e.g. Symantec, McAfee) kind of software which might monitor the network transfer from DocumentBurster™ to the email server (e.g. Microsoft Exchange). Such intermediate layers will slow down the network performance and, if email sending performance is a critical requirement, the IT administrator of your organization should check for various approaches to minimize the performance cost of these intermediate layers. The simplest approach would be to decide that all the emails which are sent by DocumentBurster™ are legitimate and do not require additional validation. Another approach might be to configure the antivirus software to do the minimum amount of scanning necessary to meet the security requirements from your organization.
DocumentBurster™ can be deployed and used in a virtual machine. The software is confirmed to run in Oracle VM VirtualBox and Microsoft Hyper-V and should work properly on other virtualization software too. Like any other software, there is a performance penalty when running DocumentBurster™ in a virtual machine as compared with running the software in a native operating system. The network quality, the CPU, Disk I/O and memory performance are the factors which influence the total throughput of the DocumentBurster™ software when running inside a virtual machine.
DocumentBurster™ has a simple, yet powerful, mechanism to monitor various report bursting and report distribution performance metrics. This mechanism can be enabled for tracking, on an ongoing basis, the report bursting and report distribution performance during production.
DocumentBurster™ monitoring system displays the most relevant report bursting and report distribution performance indicators with the help of various graphs which are easy to understand and visualize.
Further more, DocumentBurster™ is publishing the performance metrics in two additional ways which can be used when integrating with professional monitoring tools
- Log file - DocumentBurster™ generates a relatively simple to read (and simple to parse) log file which contains aggregated performance statistics. When compared with the graphs, the log file contains a bigger set of performance metrics (at the cost of being less easy to read) and, if required, can be automatically polled and parsed for raw performance data by other third party monitoring tools.
- JMX - DocumentBurster™ exposes performance metrics through JMX so that monitors can be set up to alert when performance degrades below acceptable thresholds. Since JMX has become the standard interface for managing and monitoring Java applications, exposing DocumentBurster™ performance data through JMX opens up a wide range of functionality provided by third party monitoring applications.
In the default installation, DocumentBurster™ does not gather any performance related data. If performance monitoring is required, then DocumentBurster™ should be configured to gather, calculate and publish the performance statistics.
DocumentBurster™
can be enabled to publish
performance metrics by doing the
modification which
is marked as bold to the first line of
config/burst/internal/documentburster.xml
configuration
file.
- existing value - <project name="documentburster" default="documentburster">
- new value - see the bold change <project name="documentburster" default=" performance-statistics">
DocumentBurster™
Server
can be enabled to publish
performance metrics by doing the
modification which
is marked as bold to the first line of
server/config/burst/internal/startServer.xml
configuration
file.
- existing value - <project name="server" default="start-server">
- new value - see the bold change <project name="server" default=" performance-statistics">
Save the configuration file(s) and run DocumentBurster™ again. Now, everytime a report is being processed, performance metrics will be published in the following two files
logs/performance/statistics.log- contains the aggregated performance statistics calculated at regular time intervals (10 seconds by default)logs/performance/graphs.log- contains Google Chart Tools URLs with DocumentBurster™ performance charts
If configured as such,
DocumentBurster™
will gather run-time performance statistics.
The data is collected
throughout the program execution
and regularly,
at a configurable
time interval (10 seconds by default)
the raw data
is processed to
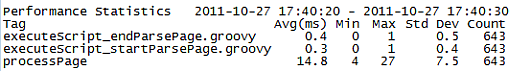
produce and log aggregated statistics such as mean,
minimum,
maximum, standard deviation and transactions per second
over
a set
time span. If monitoring is enabled, the aggregated
statistics
will
be
available in
logs/performance/statistics.log
log file.
Example of performance statistics log file
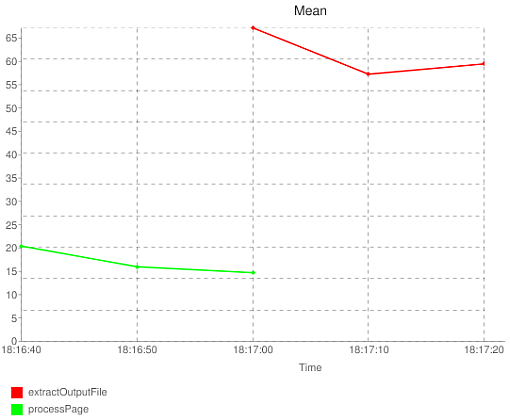
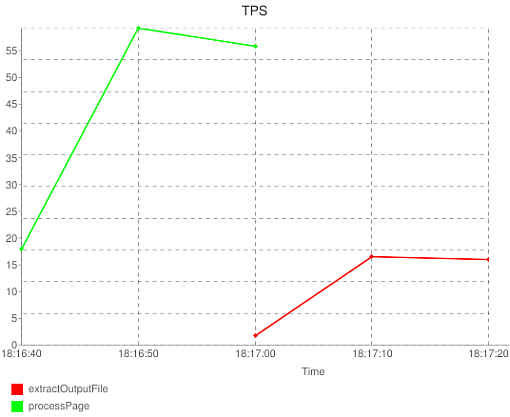
If monitoring is enabled, DocumentBurster™ will generate graphs for the average execution time and transactions per second for the following transaction types
- processPage - transaction which is parsing the text of one page of the report for burst tokens and variable values.
- extractOutputFile - transaction which is extracting a separate burst report.
- send - transaction which is distributing the previously extracted report.
The graphs are generated as URLs to Google Chart Server in
logs/performance/graphs.log
log file.
Mean Execution Times (ms)
Transactions Per Second
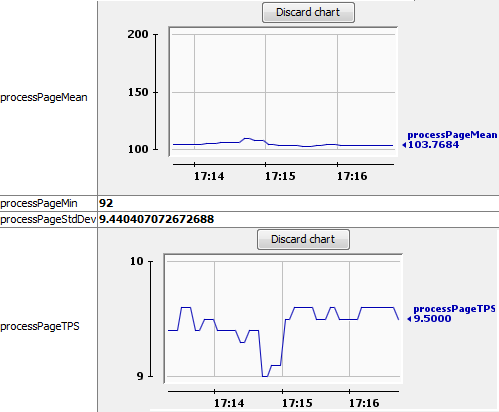
If performance monitoring is enabled, DocumentBurster™ does expose the performance data using the JMX standard. Exposing DocumentBurster™ performance data using JMX opens up a wide range of functionality, such as:
- DocumentBurster™ performance metrics can be visualized using existing Java JMX consoles like JConsole or MC4J Management Console.
- Through JMX, DocumentBurster™ has the premises to be monitored using professional network monitoring software like Nagios or OpenNMS.
Visualize report bursting and report distribution performance metrics using JConsole
If required, for more advanced monitoring scenarios, DocumentBurster™ has the technical premises to be integrated with other professional monitoring tools. Such an advanced monitoring tool will allow, for example, to define performance thresholds on DocumentBurster™ metrics and to raise an alert whenever the minimum performance thresholds are not met. Once raised, the alert can be either displayed in a monitoring dashboard using red color or can be sent by email to one or more configured email addresses.
While DocumentBurster™ 's monitoring system is not directly dependent on any, it can be integrated with most of the existing network monitoring platforms such as Nagios, Cacti, Hyperic, Zenoss, SpiceWorks, GroundWork, Zabbix or OpenNMS. If the IT department of your organization has already standardized on using an existing platform for doing system monitoring then it should be possible to add DocumentBurster™ to the list of applications which are closely monitored.
The documentation of the selected monitoring vendor should be consulted in order to find details on how to define and monitor a new application. In general, such tools will allow to fetch the required DocumentBurster™ performance data by either
-
Constantly polling and parsing of the raw
DocumentBurster™
performance log file -
logs/performance/statistics.logfor the required data. - By using a JMX adaptor (provided by the third party tool), remotely connect and read the performance data which is exposed by DocumentBurster™ using JMX.
Google Chart Tools - DocumentBurster™ is displaying the performance charts using Google Charts
JMX - DocumentBurster™ exposes performance metrics through JMX
JConsole - DocumentBurster™ can be monitored using JConsole
Nagios documentation - general documentation useful when monitoring DocumentBurster™ through Nagios
Cacti documentation - general docs useful when using Cacti
Hyperic HQ documentation - Hyperic HQ
Zenoss documentation - Zenoss
Spiceworks - Spiceworks
GroundWork - network and application monitoring software - GroundWork
Zabbix - Monitoring software - Zabbix
OpenNMS - Monitoring software - OpenNMS